
Transitioning fault detection into production
Much as an EKG shows the rhythm of a heart, the trace data of a tool can show the health of a tool. The data collected are values like pressure, temperature, and gas flow. Fault detection is the identification of changes in tool operations by comparing the trace to a model. It shows engineers how the tool is performing and can signal failures like MFC or power control problems. Because the data is real time, a failure detection can intercept the next wafer rather than wait for a post process metrology tool to identify a problem.
Contents
• Introduction
• Architecture
• Implementation process
• Participants
• Lessons learned
• Tools
• Conclusions
Introduction
Equipment integration (EI) at AMD started in 1993 with Consilium's DFS components. The EI projects, focused on recipe control and data collection, provided great productivity improvements. In 1997 AMD's Submicron Development Center (SDC) started an evaluation of the Triant Technologies Inc. fault detection software. It took several iterations for the AMD EIs to provide the correct format for Triant to read. We started our evaluation on Novellus Dielectric and FSI Mercury systems in the diffusion cell. The engineers wanted a better understanding of the operation of their tools.
Our first success occurred two months after we started. One FSI Mercury system was aborting during a specific recipe. Comparing the trace information of a problem lot with the model showed that the tool was running correctly. The engineer could focus on other potential problems. He found bubbles in the supply line. While not a straightforward success this experience built support for further work. The engineers responsible for other FSI Mercury asked when they could get Triant running on their systems.
We chose to use the Triant software to implement fault detection for several reasons. During a Sematech advanced process control (APC) thrust evaluation, Triant was one of the top FD suppliers. The software supports a client/server architecture, which allowed integration with our existing EI's and data center supported server. It did not require a "PC farm" around the tool. And it was easy to integrate with our existing architecture. Other evaluated systems often broke the EI to the tool. Our integrated solution allowed both.
Back to top
Architecture
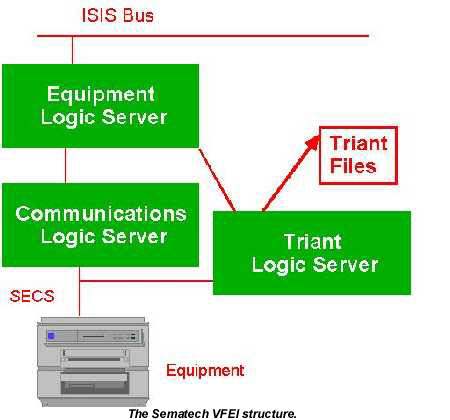
The Sematech VFEI structure defines two levels of code: the Equipment Logic Server (ELS) and the Communication Logic Server (CLS). These two levels allow separation of control. We added a second communications level for Triant. This second CLS obtains its setup information from the ELS, intercepts the trace data from the standard CLS, and then outputs Triant readable files. We can add a Triant CLS without affecting the rest of the EI.
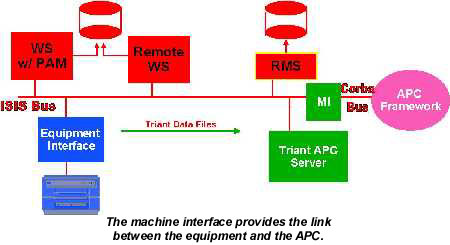
The Machine Interface (MI) provides integration of the trace data collection with the APC framework and legacy MES systems, and allows translation to Corba from legacy messaging systems. The trace data can be sent through the MI to APC for processing via Triant.
We used features of the Recipe Management Server, RMS, to overcome the limitations of trace data collection and provide flexibility. Tool data speeds are limited and sample rates have been reduced because tools "lose events". We attached a sub-recipe to the tool recipe to identify what data to collect, allowing customization of data collected for chamber recipes without requesting useless parameters. The ELS removes this sub-recipe from the main tool recipe before sending the recipe to the CLS.
The furnace engineers also wanted to investigate the use of fault detection on their system, but the furnace group control already collected the trace data. So, AMD & TEL teamed up to evaluate the use of FDC on furnaces. TEL developed a reformatter that creates a Triant file in an exported directory on the Group Controller. This reformatter allows the Triant APC server to process data in the same manner as an EI.
Back to top
Implementation process
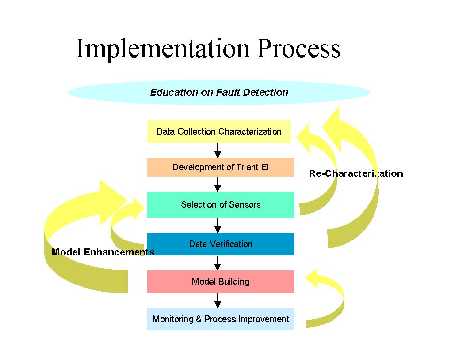
The implementation of fault detection is an iterative process. Often, the implementation team needs to recharacterize the data, improve the fault detection model, or develop a new model after a process improvement.
Step zero – Education
First of all, and during the entire process, educate management and engineers on the benefits of fault detection (FD). Explain the benefits of FD and how it complements traditional SPC practices by potentially shortening the time to detect an equipment issue. The ability to easily collect and analyze trace data is exciting to engineers. The other part of the education process involves learning the Triant Modelware software and gaining basic knowledge and understanding of nearest neighbors modeling and the concept of a "multivariate" measure of system health.
Step one - Pilot data collection
Pilot data collection shows what type of sensor data can be collected from the tool and what sampling frequency the tool can provide or handle. This is done by working with the tool owner and if necessary the supplier to determine the SVID's. Often a laptop computer is taken into the fab and connected to the equipment to collect a sample trace via the SECS message.
Step two - Equipment interface
After verifying that trace data can be collected from a tool, develop the equipment interface and modify the main recipe to include the Triant subrecipe. The Triant subrecipe allows different sensor data to be collected for different recipes. At this point, tool monitoring determines if there are any lost events (i.e., the sampling rate is greater than the rate at which the tool can process the event).
Step three – Sensors
Next, decide what sensor data should be monitored or model for each recipe. The equipment engineer should start considering how the process will be modeled in terms of the "active, passive, and data only" roles as defined by Triant. These sensors are then specified in the Triant Subrecipe.
Step four - Data verification
Some engineers are satisfied that the data is correct simply by viewing data using Triant's Modelview which shows a trend chart of the sensor data for a given lot. Others want to view the specific numbers and prefer exporting the trace data to Excel to do so. Either way the data verification process begins to introduce the fault detection software and demonstrate some of its built-in functionality.
Step five - Model building
Once the data has been verified the model building can begin. We start by showing the team how to build a model with the ModelMaker component of the Triant software. Typically we hold weekly team meetings during this phase. We practice building new models and discuss what fault signals the software might have identified during the previous week. If necessary, existing models are revised and improved. The summary report feature of Triant, introduced during this phase, provides a quick way to look at the performance of the tool over numerous lots.
Step six - Monitoring and process improvement
In the monitoring and process improvement phase, real-time tool SPC has been achieved. The Triant software is installed inside the fab to give engineers and wafer fab technicians access to fault detection data. Two methods can provide real-time feedback on equipment faults. The first uses the EI to log the tool down if a fault of a certain severity is detected. The wafer fab technician must acknowledge the problem and comment on what might have caused it. The second feedback mechanism involves sending an email describing the fault to a distribution list.
As mentioned, the implementation process can be iterative. Different issues that may arise during implementation may trigger the need to revisit a previous step.
Back to top
Participants
After the decision to implement fault detection, four primary groups participate in this implementation process.
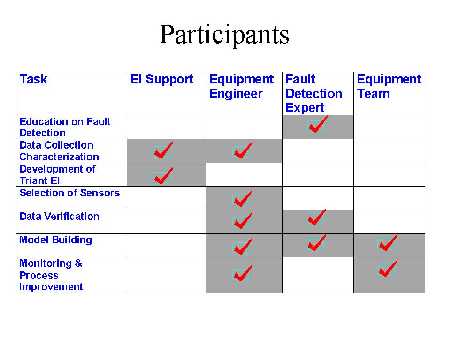
At the beginning of each fault detection implementation, we identify an equipment engineer as the project leader. This person works with the EI and fault detection support directly. EI support is needed during the data characterization and EI development phases. Fault detection expertise is needed during the education phase as well as the data verification and model building phases. The equipment engineer and an equipment team are involved in the model building as well as the monitoring and process improvement. The ultimate goal is to familiarize the equipment engineer with the methodology and software so that minimal support is need from the EI and fault detection side.
Back to top
Lessons learned
We learned many lessons about the implementation process. They can be categorized into two groups: start-up and new philosophy.
A primary part of the start-up phase is simply promoting the use and benefits of fault detection. One of the ways which we chose to accomplish this was by identifying case studies where standard process monitoring methods failed to catch a tool-related issue in a timely manner. A chart showed the "time to detect an equipment issue" using various monitoring methods (i.e., SPC, inline inspections, electrical test, sort) and how fault detection could potentially shorten the length of time a piece of equipment operates with problems before it is detected. Another part of the start-up phase includes working the kinks out of the data collection. We underestimated the amount of effort that this part of the process would require. Issues for individual tools included a too slow sampling rate, difficulty collecting data from the desired sensors, and difficulty collecting step duration information.
Another lesson learned relates to the acceptance of a new philosophy in tool/process monitoring. Some have been very eager to implement fault detection. Others say "my tool hasn't had a problem in six months, why should I make the effort to implement the software." Of course we believe the last case represents a naïve way of thinking (why have an SPC chart?). Much can be learned from the modeling of trace data regardless of the number of equipment faults.
Back to top
Tools
Our initial projects expanded to look at several different tools. We focused on applications other than the etch processes that have received so much focus from Sematech. Each tool has had problems that we have worked to resolve.
Our FSI Mercury systems are ten years old and run with a 286 processor that can only provide data once per minute without losing event reports. Even with this limitation, these tools provided our first success. We have since upgraded one system to evaluate a faster processor.
The Novellus Concept 1 systems can only provide trace data every 15 seconds, which may not provide data on every wafer. Short recipes did not produce enough data to create a model. Even though we do not see every wafer the trace is consistent between lots.
The GEM interface board on the Centura RTA reduces data to a five second rate because it uses a slow 486 processor translating SECS messages from the tool into GEM messages for the EI. Only long recipes can be modeled, because of the data rate. The alternative is to place a PC between the SECS interface and the GEM board to collect data.
There are no data volume problems with the TEL furnace. We are working to tune models by adding recipe step information.
Back to top
Conclusions
Fault detection can provide an extra level of defense against tool-related processing issues. It can shorten the time to detect an issue from days to minutes. However, implementation of fault detection is a definitely a process. Along the way it may be necessary to return to a previous process step. It is important to have a team in place which is enthusiastic about the implementation and resilient in the face of difficulties encountered along the way.
Back to top
For more information contact AMD Headquarters, One AMD Place, P.O. Box 3453, Sunnyvale, CA 94088. E-mail: susan.parker@amd.com".